CARTOGRAPHIES OF EMERGENCY
GEOGRAPHIES AND LANGUAGES OF CONTEMPORARY CRISES
DOI:
https://doi.org/10.82068/pgjournal.2025.22.41.14Keywords:
Emergency design, Map-making, Critical cartography, Information design, Data visualisationAbstract
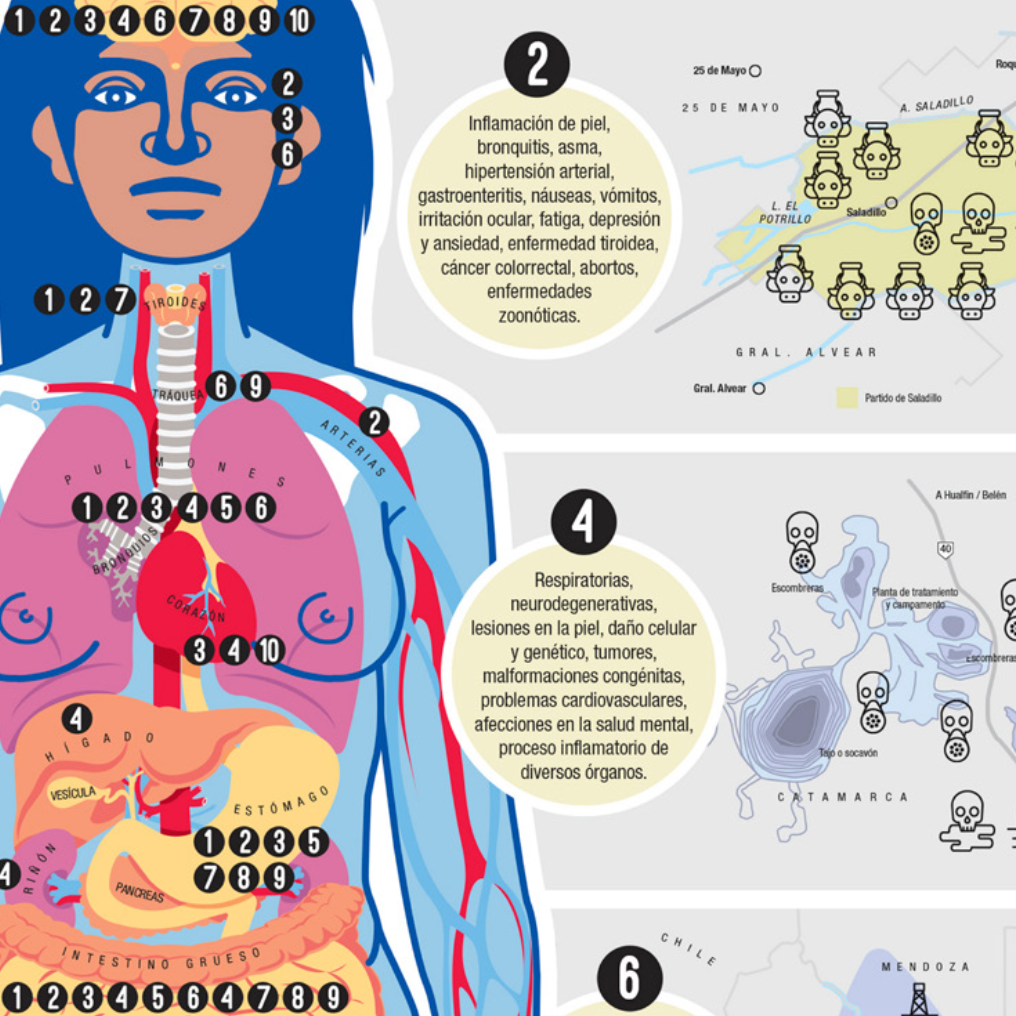
The article explores the interconnection between graphic design and cartography, with a specific focus on maps created in emergency contexts. The analysis deals with case studies at the intersection of information design, cartographic implementations and contemporary crises considered as relevant application scenarios. By reflecting on how platforms, technologies and visual languages shape not only
the representational possibilities of maps but also the construction of meaning and the way they are understood and interpreted, the study highlights the blurring or overlapping of roles between designer and user, in a breakdown of similarities and divergences that lead to multiplications and, at times, the shattering of identity. To this end, a selection of exemplary visualisations was identified according to a list of specific design objectives: information, dissemination, preparation, investigation, participation, reaction and activism. The selected maps are analysed through a methodological framework that integrates theoretical models of visualisation, reflections on modes of user interaction and approaches borrowed from critical cartography. The final objective is to clarify the impact of the implemented textual and visual choices on our understanding of the described phenomena.
References
Alliance for Disaster Reduction Designs (ADD). (2024). Disaster-resilient “human development” and “community development” disaster prevention design. Designprotect, 37(1), 1–12.
Beck, U. (2000). La società del rischio. Verso una seconda modernità. Carocci.
Bertin, J. (2011). Semiology of graphics: Diagrams, networks, maps. ESRI Press. (Original work published 1967)
Bortoloni, L. (2024). Mapping floods. Climate change, extreme weather events, and geographic data visualisation from a visual communication design perspective. In B. Tejerina, C. Miranda de Almeida, & C. Acuña (Eds.), Socioecos 2024. Conference proceedings June 6–7, 2024: Climate change, sustainability and socio-ecological practices (pp. 458–470). Universidad del País Vasco / Euskal Herriko Unibertsitatea. https://doi.org/10.1387/conf.socioecos.2024
Bortoloni, L., & Turrini, D. (2025). Progettazione grafica per le emergenze: Design e utilizzo di mappe nel contesto del cambiamento climatico. In L. Pietroni & D. Turrini (Eds.), Design for survival. Giunti.
Cairo, A. (2019). How charts lie: Getting smarter about visual information. W. W. Norton & Company.
Carraro, V. (2024). Map fetishism and the power of maps. In T. Rossetto & L. Lo Presti (Eds.), The Routledge handbook of cartographic humanities (pp. 200–207). Routledge.
Davis, M. (1999). Geografie della paura. Los Angeles: L’immaginario collettivo del disastro. Feltrinelli.
Dezidério Souto, R., & Bortoloni, L. (2025). Acessando informações em momentos de crise—Entrevista com a Dra. Raquel Dezidério Souto, sobre o desastre do Rio Grande do Sul (Brasil), ocorrido em abril e maio de 2024. IVIDES.org. https://doi.org/10.5281/zenodo.15058822
Gartner, G. (1998). About the quality of maps. Cartographic Perspectives, 30, 38–46. https://doi.org/10.14714/CP30.662
Gibson, J. J. (1966). The senses considered as perceptual systems. George Allen & Unwin.
Graham, M., & Dittus, M. (2022). Geographies of digital exclusion: Data and inequality. Pluto Press.
Grootens, J. (2010). Notes on the design. In M. Shoshan (Ed.), Atlas of the conflict: Israel–Palestine (pp. 10–11). 010 Publishers.
Grootens, J. (2021). Blind maps and blue dots: The blurring of the producer–user divide in the production of visual information. Lars Müller Publishers.
Halder, S., & Michel, B. (2018). Editorial – This is not an atlas. In Kollective Orangotango+ (Ed.), This is not an atlas: A global collection of counter-cartographies (pp. 12–21). transcript Verlag.
Haraway, D. (1988). Situated knowledges: The science question in feminism and the privilege of partial perspective. Feminist Studies, 14(3), 575–599.
Harley, J. B. (1988). Silences and secrecy: The hidden agenda of cartography in early modern Europe. Imago Mundi, 40, 57–76.
Konstantinou, E. N., Skopeliti, A., & Nakos, B. (2023). POI symbol design in web cartography—A comparative study. ISPRS International Journal of Geo-Information, 12(7), 254. https://doi.org/10.3390/ijgi12070254
MacEachren, A. M. (2012). How maps work. Guilford Press.
Milev, Y. (2011). Emergency design—New semiotic orders of urban survival. In A. Gleiniger, A. Hilbeck, & J. Scott (Eds.), Transdiscourse 1 (pp. 145–160). Springer.
Norman, D. A. (1988). The psychology of everyday things. Basic Books.
Perondi, L. (2012). Sinsemie. Scrittura nello spazio. Stampa Alternativa.
Pickles, J. (2006). A history of spaces: Cartographic reason, mapping, and the geo-coded world. Routledge.
Piscitelli, D. (2019). First things first: Comunicare le emergenze. Il design per una contemporaneità fragile. LISt Lab.
Ramírez, R. (2018). Reviewing open-access icons for emergency: A case study testing meaning performance in Guemil. Visible Language, 52(2), 32–55.
Roth, R. E. (2017). Visual variables. In D. Richardson, N. Castree, M. F. Goodchild, A. Kobayashi, W. Liu, & R. A. Marston (Eds.), The International Encyclopedia of Geography (pp. 1–11). John Wiley & Sons.
Roth, R. E. (2021). Cartographic design as visual storytelling: Synthesis and review of map-based narratives, genres, and tropes. The Cartographic Journal, 58(1), 83–114. https://doi.org/10.1080/00087041.2019.1633103
Urabe, K., Hayashi, H., Inoue, S., Yoshida, H., & Shimosakai, Y. (2010). Design principles for visualization of public information for effective disaster reduction. Journal of Disaster Research, 5(1), 1–14.
Van Manen, S. M., Jaenichen, C., Lin, T. S., Kremer, K., & Ramírez, R. (2023). Design for emergency management. Routledge.
Zejdlik, J., & Vozenilek, V. (2024). Exploring cartographic differences in web map applications: Evaluating design, scale, and usability. ISPRS International Journal of Geo-Information, 14(1), 9. https://doi.org/10.3390/ijgi14010009
Downloads
Published
Issue
Section
License
Copyright (c) 2025 Progetto Grafico Journal

This work is licensed under a Creative Commons Attribution-NonCommercial-ShareAlike 4.0 International License.
