MAPPING INEQUALITIES
A GENEALOGICAL ANALYSIS OF INEQUALITY VISUALIZATION FROM HISTORICAL MAPS TO CONTEMPORARY DIGITAL INTERFACES
DOI:
https://doi.org/10.82068/pgjournal.2025.22.41.15Keywords:
Communication Design, Design for Activism, Information Design, Social Inequalities, InteractivityAbstract
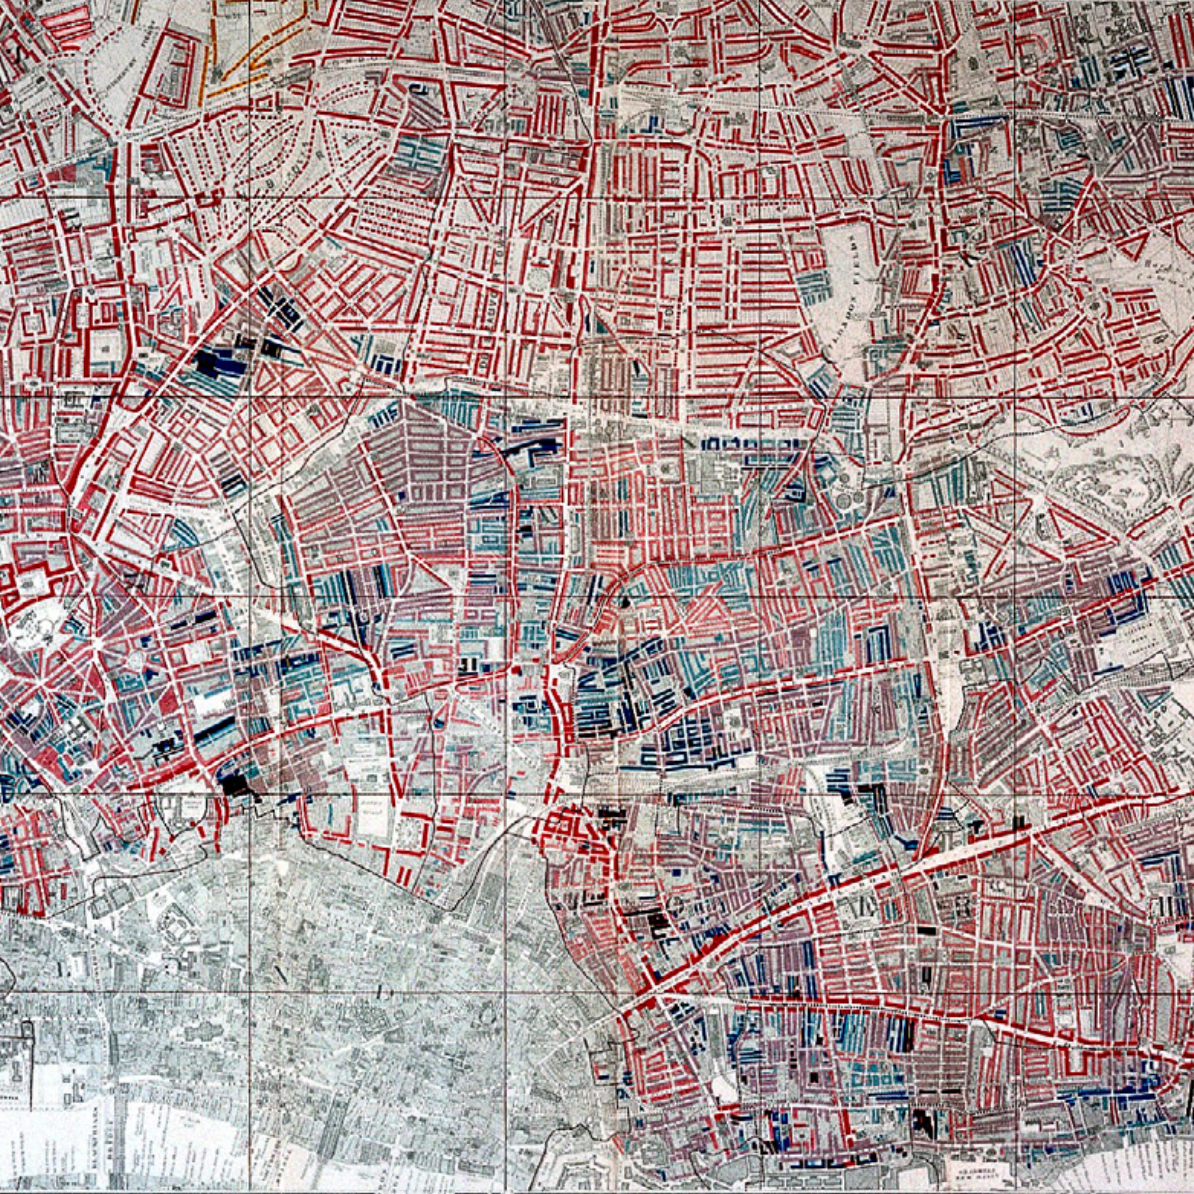
This study investigates the evolution of inequality visualization through a genealogical analysis spanning, inside the topic, from early 19th-century maps to contemporary digital interfaces. The research documents how graphic representation of social disparities has progressively evolved from a documentation tool to a device of resistance and active participation. After an introduction to the theme of inequality and the potential of graphic visualizations to represent highly complex issues, the paper presents some examples of disparity mapping from past centuries. The analysis of emblematic historical cases – from Parent du Châtelet's and W.E.B. Du Bois's maps to William Bunge's militant visualizations – reveals how each era has developed specific modalities for visual translation of social data to represent the multiplicity of inequalities. In the second part of the text, three contemporary case studies exemplify the transition toward interactive paradigms that integrate gamification, big data analytics, and forms of participatory advocacy.
The research demonstrates how this evolution constitutes an epistemological revolution that transforms users from passive recipients to active
co-constructors of knowledge. Finally, the conclusions highlight how current cases represent a transitional phase toward possible post-digital configurations, emphasizing the need to orient emerging technologies toward democratizing access to knowledge and amplifying marginalized voices.
References
Aziz, M., & Uddin, M. S. (2021). Philosophical thoughts on inequality from ancient Greece to pre-Enlightenment period. In Encyclopedia of the UN Sustainable Development Goals. Springer International Publishing. https://doi.org/10.1007/978-3-319-95882-8_31
Battle-Baptist, W., & Rusert, B. (2018). W. E. B. Du Bois’s data portraits: Visualizing Black America. Princeton Architectural Press.
Baule, G. (2012). Trasfigurazioni di genere. Immagini forti, immagini fragili: Il design della comunicazione. In G. Baule & V. Bucchetti (Eds.), Anticorpi comunicativi. Progettare per la comunicazione di genere. FrancoAngeli.
Baule, G., & Caratti, E. (Eds.). (2016). Design è traduzione: Il paradigma traduttivo per la cultura del progetto. FrancoAngeli.
Beramendi, P., & Rogers, M. (2022). Geography, capacity, and inequality: Spatial inequality. Cambridge University Press. https://doi.org/10.1017/9781108908702
Cairo, A. (2016). L’arte del vero: Dati, grafici e mappe per la comunicazione. Pearson.
Cairo, A. (2025). Seeing more. Seeing differently. Seeing together. In Diagrams: A project by AMO/OMA (pp. 11–15). Fondazione Prada.
Calero Valdez, A., Ziefle, M., & Sedlmair, M. (2018). Studying biases in visualization research: Framework and methods. In G. Ellis (Ed.), Cognitive biases in visualizations. Springer. https://doi.org/10.1007/978-3-319-95831-6_2
Crampton, J. W. (2010). Mapping: A critical introduction to cartography and GIS. Wiley-Blackwell. https://doi.org/10.1002/9781444317411
D’Ignazio, C., & Klein, L. F. (2020). Data feminism. MIT Press.
Hayles, N. K. (2012). How we think: Digital media and contemporary technogenesis. University of Chicago Press.
Katz, C., Heynen, N., & Warren, G. (2019). Myths, cults, memories, and revisions in radical geographic history: Revisiting the Detroit Geographical Expedition and Institute. In T. Barnes & E. Sheppard (Eds.), Spatial histories of radical geography: North America and beyond. https://doi.org/10.1002/9781119404781
Kennedy, H., & Hill, R. L. (2018). The feeling of numbers: Emotions in everyday engagements with data and their visualisation. Sociology, 52(4), 830–848. https://doi.org/10.1177/0038038516674675
Kimball, M. A. (2006). London through rose-colored graphics: Visual rhetoric and information graphic design in Charles Booth’s maps of London poverty. Journal of Technical Writing and Communication, 36(4), 353–381. https://doi.org/10.2190/K561-40P2-5422-PTG2
Koolhaas, R., & Inozemtseva, K. (2025). On diagrams. In Diagrams: A project by AMO/OMA (pp. 11–15). Fondazione Prada.
Lupton, D. (2016). The quantified self. Polity Press.
Manchia, V. (2020). Il discorso dei dati: Note semiotiche sulla visualizzazione delle informazioni. FrancoAngeli.
Manovich, L. (2001). The language of new media. MIT Press.
Milan, S. (2017). Data activism as the new frontier of media activism. In V. Pickard & G. Yang (Eds.), Media activism in the digital age (pp. 151–163). Routledge. https://doi.org/10.4324/9781315393940
Moro, E., Calacci, D., Dong, X., & Pentland, A. (2021). Mobility patterns are associated with experienced income segregation in large US cities. Nature Communications, 12, 4633. https://doi.org/10.1038/s41467-021-24899-8
Perondi, L. (2012). Sinsemie. Scrittura nello spazio. Stampa Alternativa & Graffiti.
Quaggiotto, M. (2016). Traduzione cartografica. Discorsi visivi per il racconto del territorio. In G. Baule & E. Caratti (Eds.), Design è traduzione. Il paradigma traduttivo per la cultura del progetto (pp. 215–230). FrancoAngeli.
Rendgen, S., & Wiedemann, J. (2019). History of information graphics. TASCHEN.
Rendgen, S. (2025). Radical praxis diagrams as a crystallization point for social thought-processes. In Diagrams: A project by AMO/OMA (pp. 122–127). Fondazione Prada.
Sánchez-Miranda, M. del C., Anta-Félez, J.-L., Grana, R., & Pérez-García, R. G. (2024). Critical reflection on inequality and precariousness in contemporary society: Reconstructing connections from social intervention. Education Sciences, 14(4), 379. https://doi.org/10.3390/educsci14040379
Sciuto, D. (2025). Inequalities. In M. Pederbelli (Ed.), Inequalities: 24th International Exhibition (p. 7). Electa.
Tufte, E. R. (1983). The visual display of quantitative information. Graphics Press.
Yabe, T., Garcia Bulle Bueno, B., Dong, X., Pentland, A., & Moro, E. (2023). Behavioral changes during the COVID-19 pandemic decreased income diversity of urban encounters. Nature Communications, 14, 2310. https://doi.org/10.1038/s41467-023-37913-y
Downloads
Published
Issue
Section
License
Copyright (c) 2025 Progetto Grafico Journal

This work is licensed under a Creative Commons Attribution-NonCommercial-ShareAlike 4.0 International License.
